Example scripts
There are various sample scripts located in the examples subdirectory.
Once you’ve built the plugin (with make), you can run them via:
$ ./gcc-with-python examples/NAME-OF-SCRIPT.py test.c
show-docs.py
A trivial script to make it easy to read the builtin documentation for the gcc API:
$ ./gcc-with-python examples/show-docs.py test.cwith this source:
import gcc
help(gcc)
giving output:
Help on built-in module gcc:

NAME
    gcc

FILE
    (built-in)

CLASSES
    __builtin__.object
        BasicBlock
        Cfg
        Edge
        Function
        Gimple
(truncated)
show-passes.py
You can see the passes being executed via:
$ ./gcc-with-python examples/show-passes.py test.c
This is a simple script that registers a trivial callback:
# Sample python script, to be run by our gcc plugin
# Show all the passes that get executed
import gcc

def my_pass_execution_callback(*args, **kwargs):
    (optpass, fun) = args
    print(args)

gcc.register_callback(gcc.PLUGIN_PASS_EXECUTION,
                      my_pass_execution_callback)
Sample output, showing passes being called on two different functions (main and helper_function):
(gcc.GimplePass(name='*warn_unused_result'), gcc.Function('main'))
(gcc.GimplePass(name='omplower'), gcc.Function('main'))
(gcc.GimplePass(name='lower'), gcc.Function('main'))
(gcc.GimplePass(name='eh'), gcc.Function('main'))
(gcc.GimplePass(name='cfg'), gcc.Function('main'))
(gcc.GimplePass(name='*warn_function_return'), gcc.Function('main'))
(gcc.GimplePass(name='*build_cgraph_edges'), gcc.Function('main'))
(gcc.GimplePass(name='*warn_unused_result'), gcc.Function('helper_function'))
(gcc.GimplePass(name='omplower'), gcc.Function('helper_function'))
(gcc.GimplePass(name='lower'), gcc.Function('helper_function'))
(gcc.GimplePass(name='eh'), gcc.Function('helper_function'))
(gcc.GimplePass(name='cfg'), gcc.Function('helper_function'))
[...truncated...]
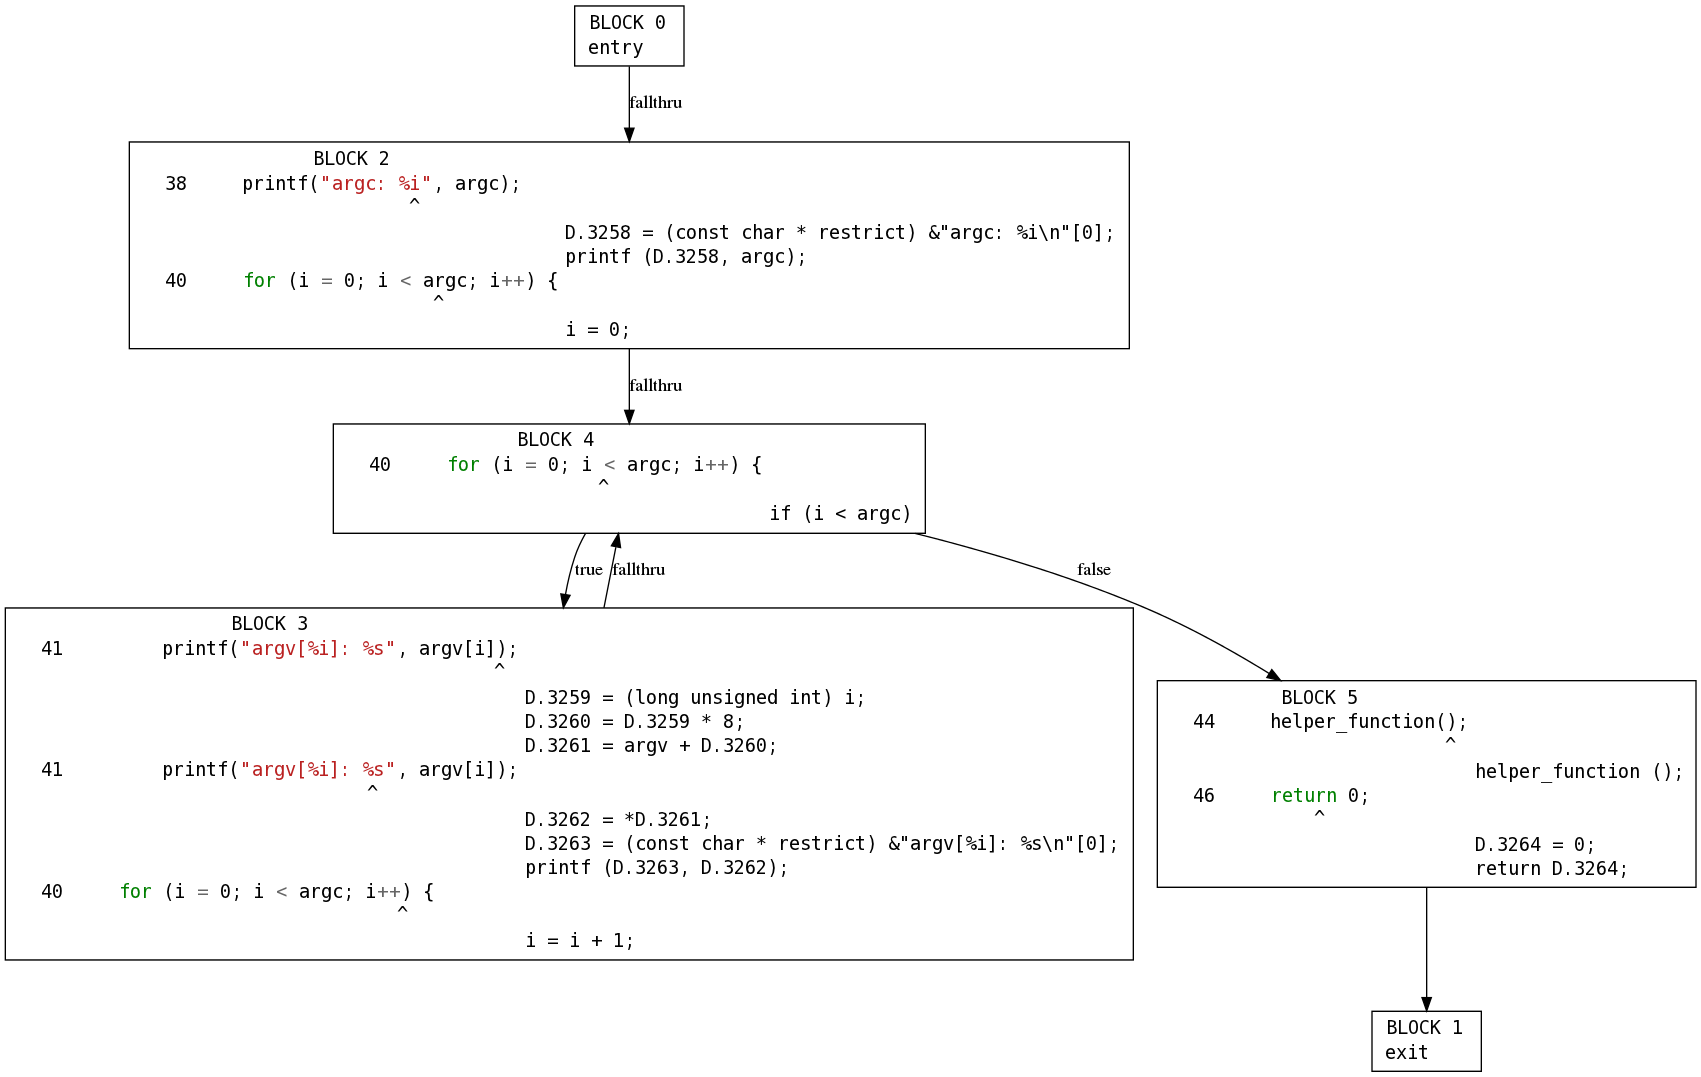
show-gimple.py
A simple script for viewing each function in the source file after it’s been converted to “GIMPLE” form, using GraphViz to visualize the control flow graph:
$ ./gcc-with-python examples/show-gimple.py test.c
It will generate a file test.png for each function, and opens it in an image viewer.
The Python code for this is:
# Show the GIMPLE form of each function, using GraphViz
import gcc
from gccutils import get_src_for_loc, cfg_to_dot, invoke_dot

# We'll implement this as a custom pass, to be called directly after the
# builtin "cfg" pass, which generates the CFG:

class ShowGimple(gcc.GimplePass):
    def execute(self, fun):
        # (the CFG should be set up by this point, and the GIMPLE is not yet
        # in SSA form)
        if fun and fun.cfg:
            dot = cfg_to_dot(fun.cfg, fun.decl.name)
            # print dot
            invoke_dot(dot, name=fun.decl.name)

ps = ShowGimple(name='show-gimple')
ps.register_after('cfg')
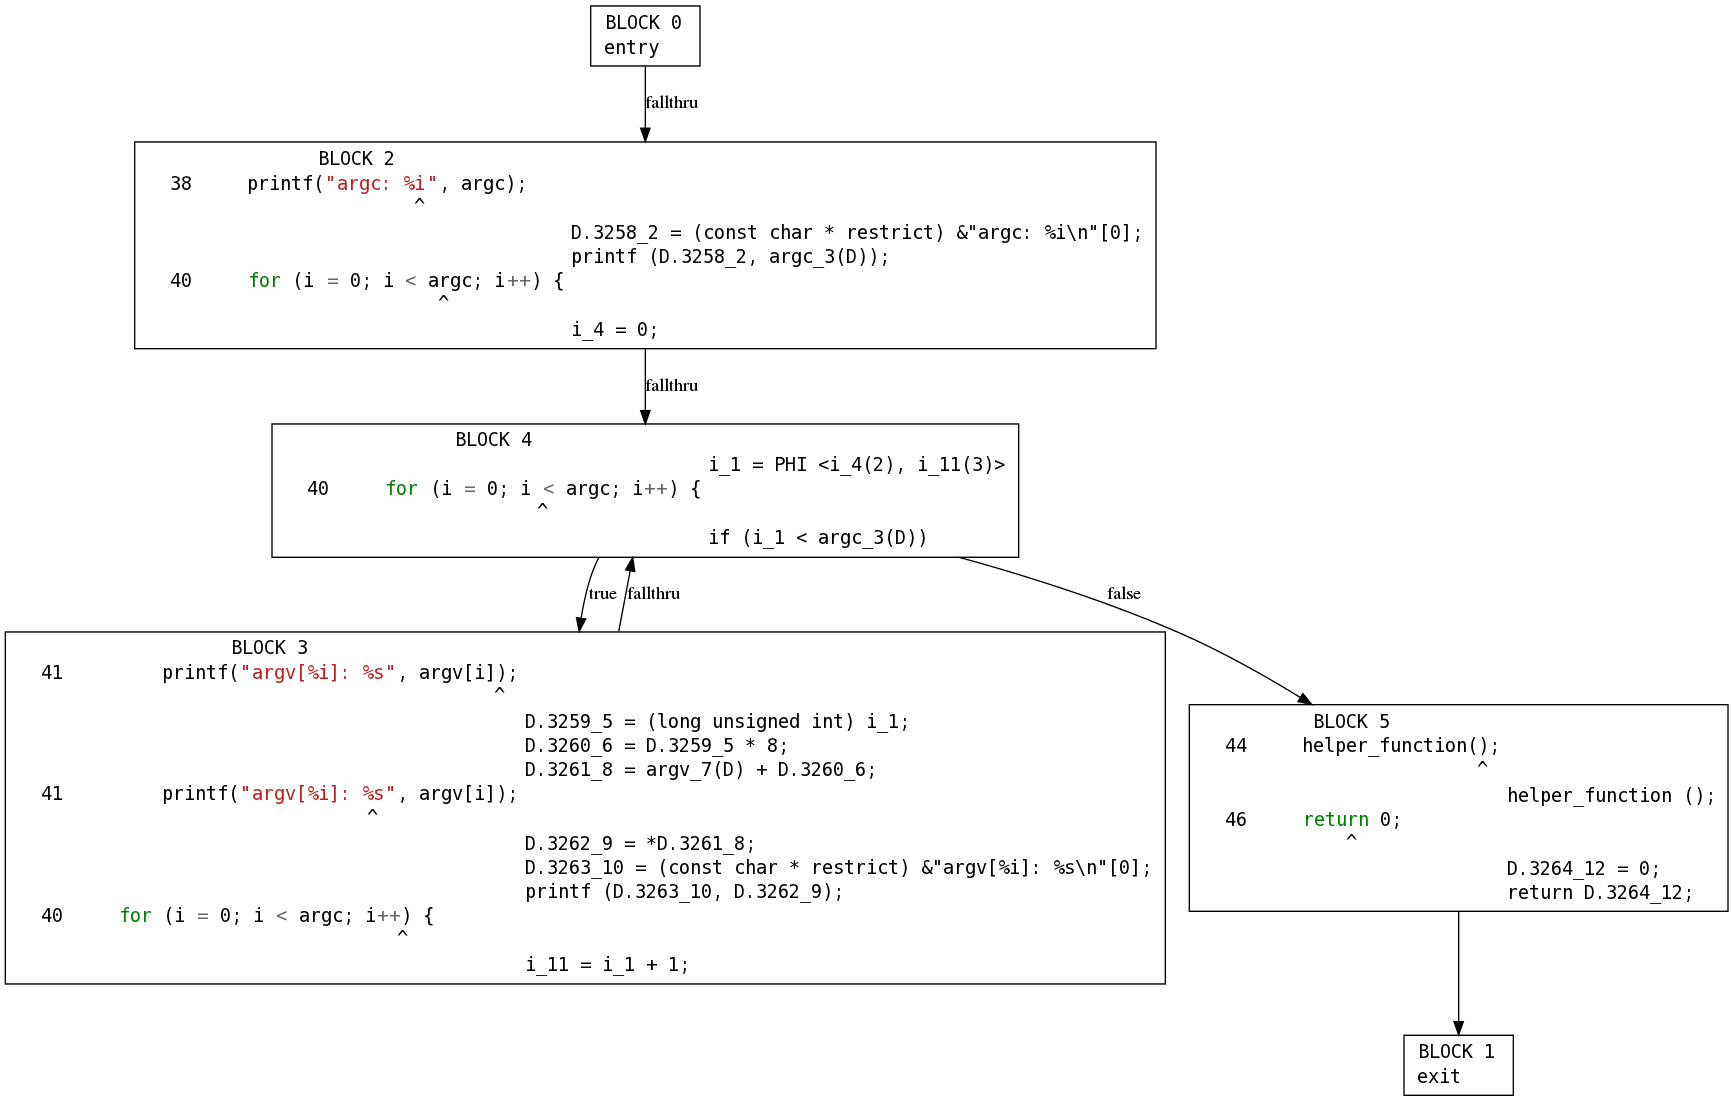
show-ssa.py
This is similar to show-gimple.py, but shows each function after the GIMPLE has been converted to Static Single Assignment form (“SSA”):
$ ./gcc-with-python examples/show-ssa.py test.c
As before, it generates an image file for each function and opens it in a viewer.
The Python code for this is:
# Sample python script, to be run by our gcc plugin
# Show the SSA form of each function, using GraphViz
import gcc
from gccutils import get_src_for_loc, cfg_to_dot, invoke_dot

# A custom GCC pass, to be called directly after the builtin "ssa" pass, which
# generates the Static Single Assignment form of the GIMPLE within the CFG:
class ShowSsa(gcc.GimplePass):
    def execute(self, fun):
        # (the SSA form of each function should have just been set up)
        if fun and fun.cfg:
            dot = cfg_to_dot(fun.cfg, fun.decl.name)
            # print(dot)
            invoke_dot(dot, name=fun.decl.name)

ps = ShowSsa(name='show-ssa')
ps.register_after('ssa')
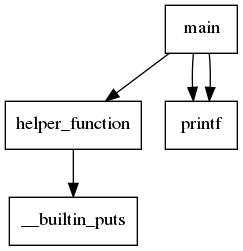
show-callgraph.py
This simple script sends GCC’s interprocedural analysis data through GraphViz.
$ ./gcc-with-python examples/show-callgraph.py test.c
It generates an image file showing which functions call which other functions, and opens it in a viewer.
The Python code for this is:
# Sample python script, to be run by our gcc plugin
# Show the call graph (interprocedural analysis), using GraphViz
import gcc
from gccutils import callgraph_to_dot, invoke_dot

# In theory we could have done this with a custom gcc.Pass registered
# directly after "*build_cgraph_edges".  However, we can only register
# relative to passes of the same kind, and that pass is a
# gcc.GimplePass, which is called per-function, and we want a one-time
# pass instead.
#
# So we instead register a callback on the one-time pass that follows it

def on_pass_execution(p, fn):
    if p.name == '*free_lang_data':
        # The '*free_lang_data' pass is called once, rather than per-function,
        # and occurs immediately after "*build_cgraph_edges", which is the
        # pass that initially builds the callgraph
        #
        # So at this point we're likely to get a good view of the callgraph
        # before further optimization passes manipulate it
        dot = callgraph_to_dot()
        invoke_dot(dot)

gcc.register_callback(gcc.PLUGIN_PASS_EXECUTION,
                      on_pass_execution)